
By
Priscilla Alexander
A Circle or Not Quite A Circle:
![]()
This write-up is for the first year
Algebra student. The write-up is for students who are looking to learn the
graphical behaviors of the equation ![]() , when
, when ![]() is a positive
integer.
is a positive
integer.
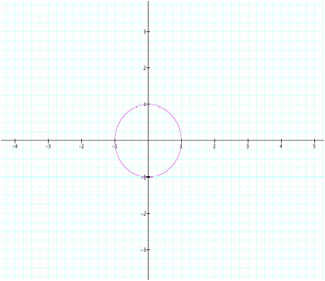
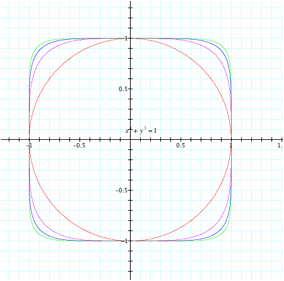
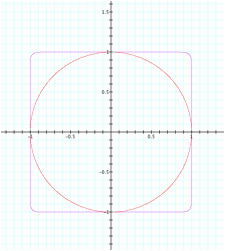
If one was to graph the
equations ![]() , and
, and ![]() , one would see that ,
, one would see that ,![]() is an equation
of a circle with y-intercept at ±1 and x- intercepts at ±1. Intercepts are points where the
graphs touches the x or y axis.
is an equation
of a circle with y-intercept at ±1 and x- intercepts at ±1. Intercepts are points where the
graphs touches the x or y axis.
See
graph
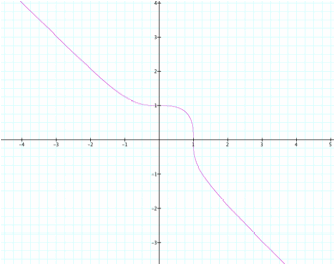
The intercepts of the
equation ,![]() are at one for
the y-axis and at one for the x-axis.
are at one for
the y-axis and at one for the x-axis.
See
graph
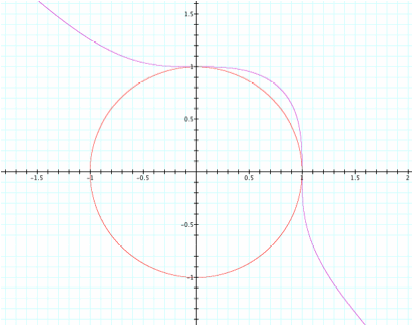
When graphed simultaneously, see graph, the two graphs intercept
with each other at one on both the y-axis and the x-axis.
This type of behavior extends to ![]() , ,
, ,![]() , and etc.
, and etc.
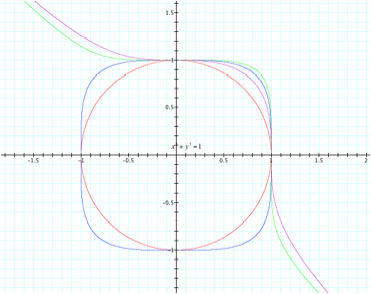
What is unique about the equations is that when ![]() is an even
exponent the graph is the expansion of the circle. Each graph have intercepts
at
is an even
exponent the graph is the expansion of the circle. Each graph have intercepts
at ![]() and
and ![]() , but the values of the domains increase with every graph.
See figure
, but the values of the domains increase with every graph.
See figure
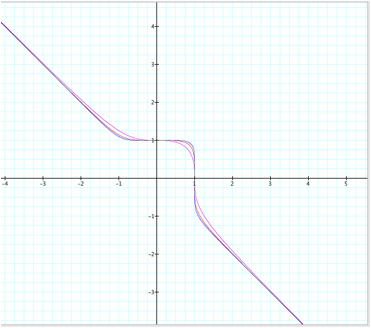
On the other hand, the
equations with odd integers for ![]() all intercept at
all intercept at
![]() and
and ![]() , but instead of expanding outward from
, but instead of expanding outward from ![]() ,,they move to the
left of the equation between
,,they move to the
left of the equation between ![]() and
and ![]() . Then the graphs of the equations start to merge at about 3 and −3.
. Then the graphs of the equations start to merge at about 3 and −3.
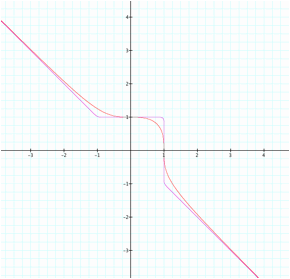
From this observation
it can be expected that the graph of ![]() , to continue to expand outward from
, to continue to expand outward from ![]() , and have x and y intercepts at ±1.
See graph
, and have x and y intercepts at ±1.
See graph
Also, as seen in the
picture, it can be expected that the graph of ![]() ,
to move to the left of ,
,
to move to the left of ,![]() in the second
and fourth quadrant. It can further be expected that the graph will intercept
at the x-axis and at the y-axis at one. Then merge in the second and fourth
quadrant after the domain of ±3.
in the second
and fourth quadrant. It can further be expected that the graph will intercept
at the x-axis and at the y-axis at one. Then merge in the second and fourth
quadrant after the domain of ±3.
From the above
exploration it can be assumed that graphs where ![]() is even integer
will behave as stated and the graphs where
is even integer
will behave as stated and the graphs where ![]() is an odd
integer will behave as stated above.
is an odd
integer will behave as stated above.